Options data analytics platform
TIMELINEJul 2025 - Aug 2025
ROLEFullstack Developer
TECH STACKNext.js, TypeScript, FastAPI, Supabase
SKILLSProduct Design, Vibe Coding, Options Trading
OVERVIEW
I started taking trading seriously...
When I decided to day-trade the Options market full-time, I had to take it seriously. Statistics say that only less than 1% of the active traders earn more than the bank's fixed deposit over a longer period. With this at the back of my mind, I was sure that discretionary trading alone cannot guarantee success over time and I need a mechanical way of understanding the market.
This is when I learned the Orderflow concepts and got to understand how markets move in its true sense. Around this time, I learned about Gamma Exposure (GEX) and the way of seeing the market from that perspective. I decided to incorporate my understanding GEX into my trading along with some mathematical edge and see how I perform.
I built a comprehensive platform that combines real-time GEX analysis with historical volatility statistics. The project solved the specific pain points I faced while trading options full-time, and helped me make better decisions quickly.
THE PROBLEM
Lack of tools, statistics and testing new concept
I searched for tools that can show me the kind of data I wanted for my trading strategy, especially the GEX metrics, in a easier to understand manner. There was no accessible way to visualize strike-level GEX for the indices Nifty and BankNifty, so that it is quicker to take decisions in the live market and I don't have to go through the huge pile of numbers that other platforms were showing.
I also developed a theory on how the repositioning in OTM greeks throughout the day on both call and put sides affected the intraday Options market and wanted to forward test this idea. Since this was not a widely known concept, there was no tool showing this kind of data.
Separately, for my positional trades, I was trading option spreads based on technical analysis of chart and it was not working. So, I decided to look up some numbers - actual standard deviation data on candle ranges, gaps, and body sizes - so I could get a realistic expectation of price movements. I couldn't find any verifiable reports publishing these numbers.
THE SOLUTION
Two tools, one platform
Since there were no tools/apps already available, I decided to build exactly what I needed to solve my own problems. I split the app into 2 sections/pages, based on the type of trade I use the data for.
Intraday GEX and Greeks Analysis:
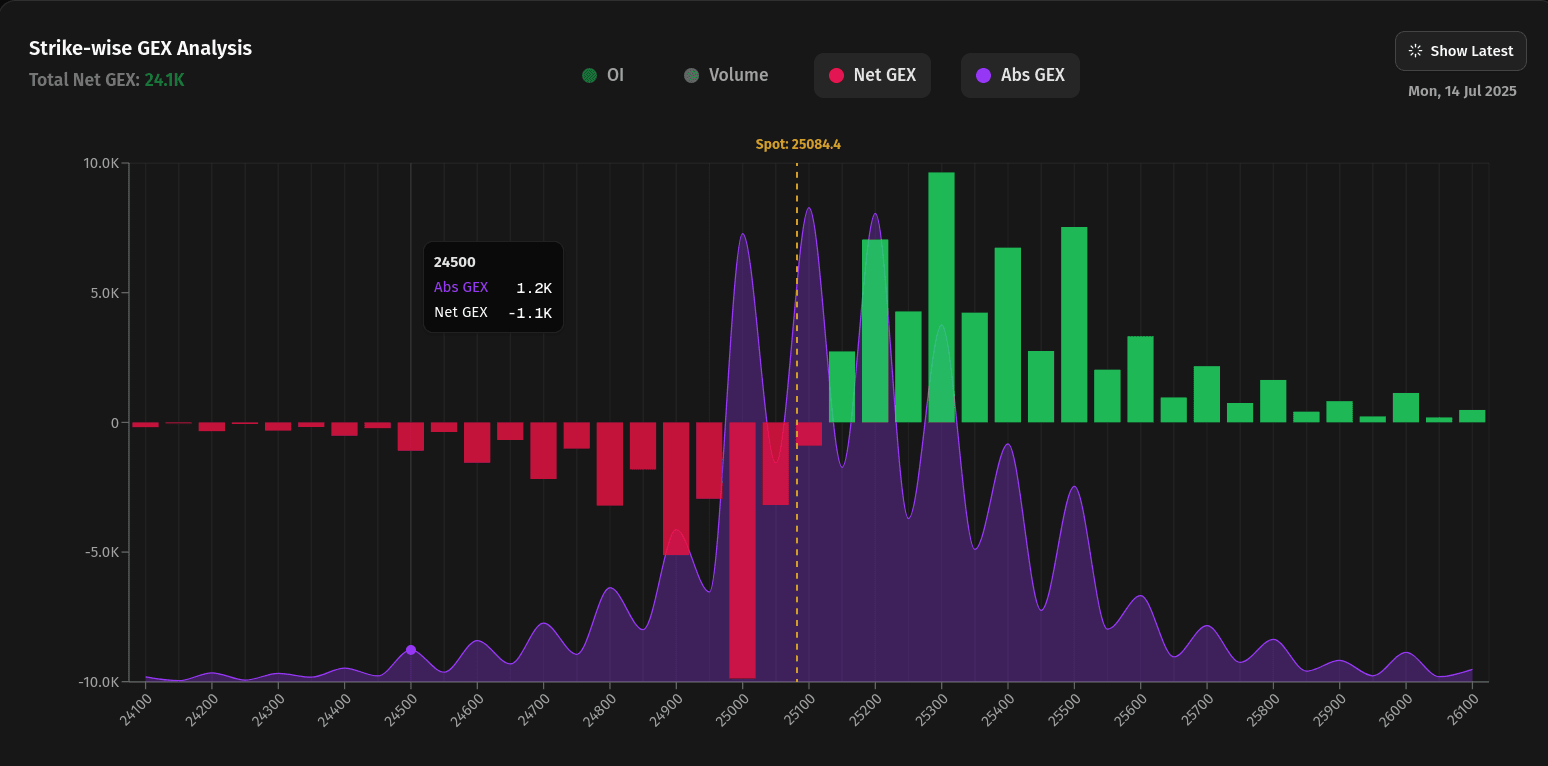
A real-time dashboard showing strike-wise Absolute & Net GEX, OI & Volume data, net GEX variation of all strikes and the change of OTM Greeks throughout the trading day. Features a filter to change the index, expiry, date and a time slider to replay intraday changes and see how positioning evolved.
A real-time dashboard showing strike-wise Absolute & Net GEX, OI & Volume data, net GEX variation of all strikes and the change of OTM Greeks throughout the trading day. Features a filter to change the index, expiry, date and a time slider to replay intraday changes and see how positioning evolved.
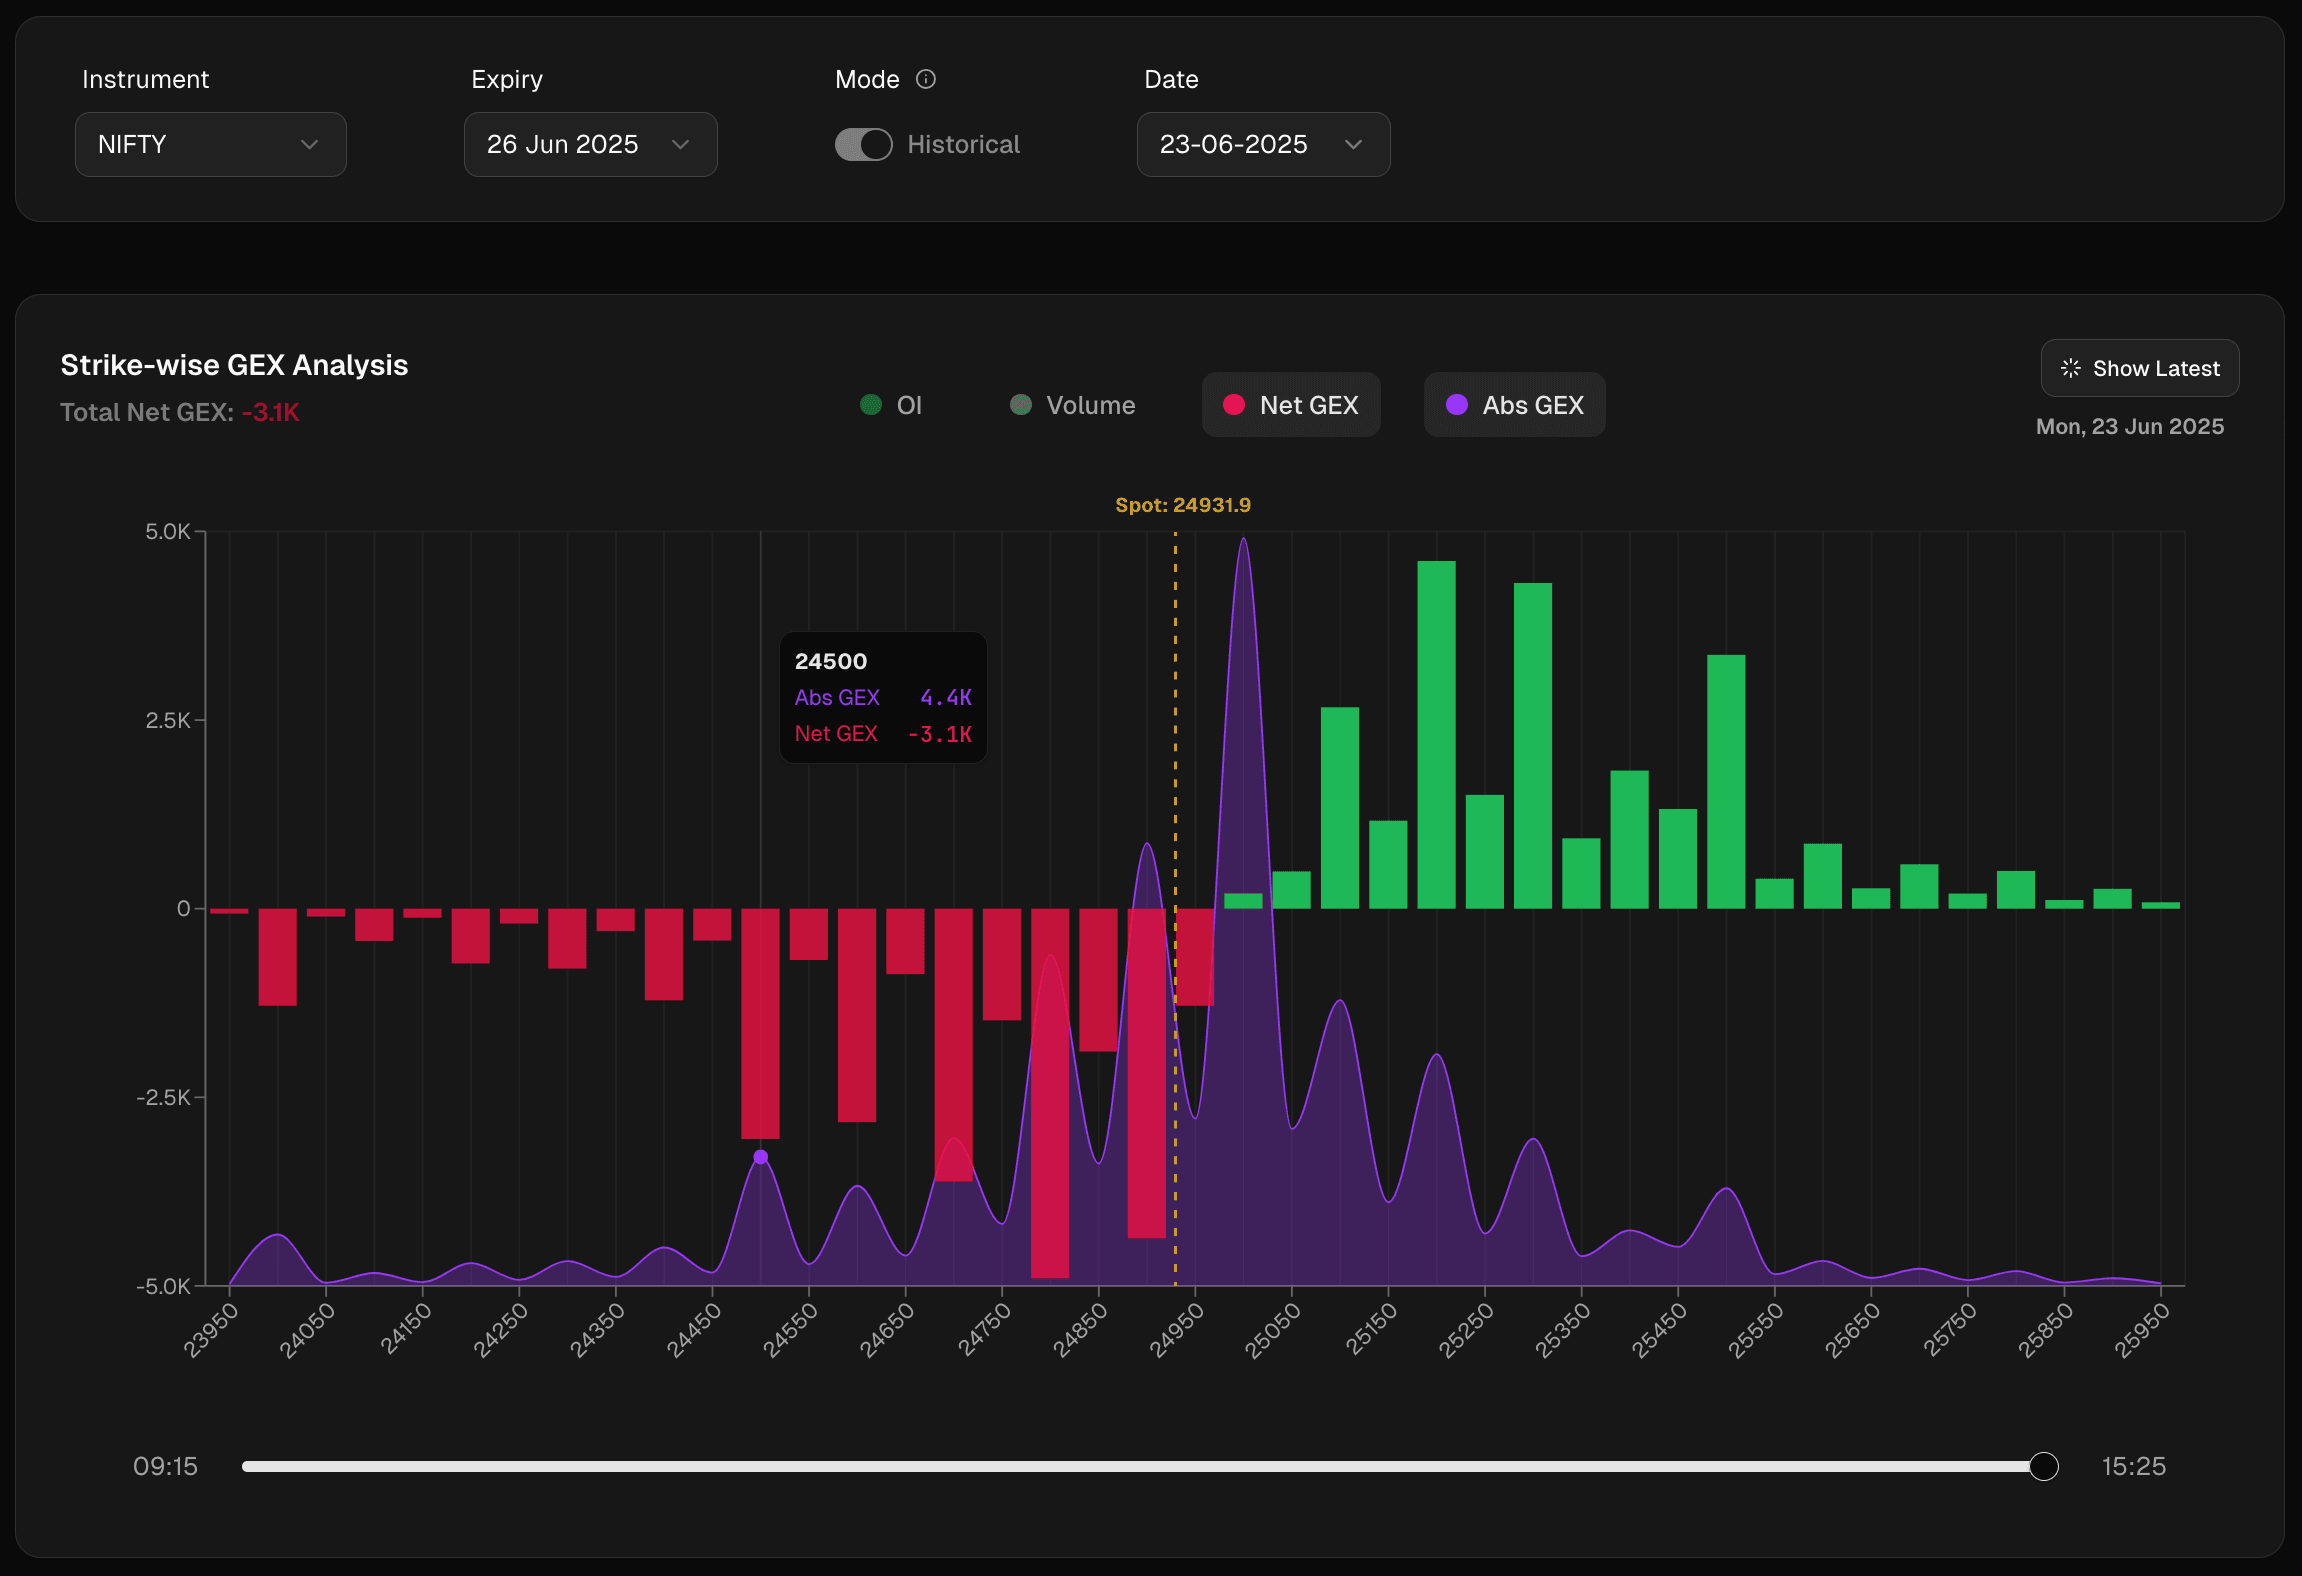 Strike-wise GEX Analysis with Filters
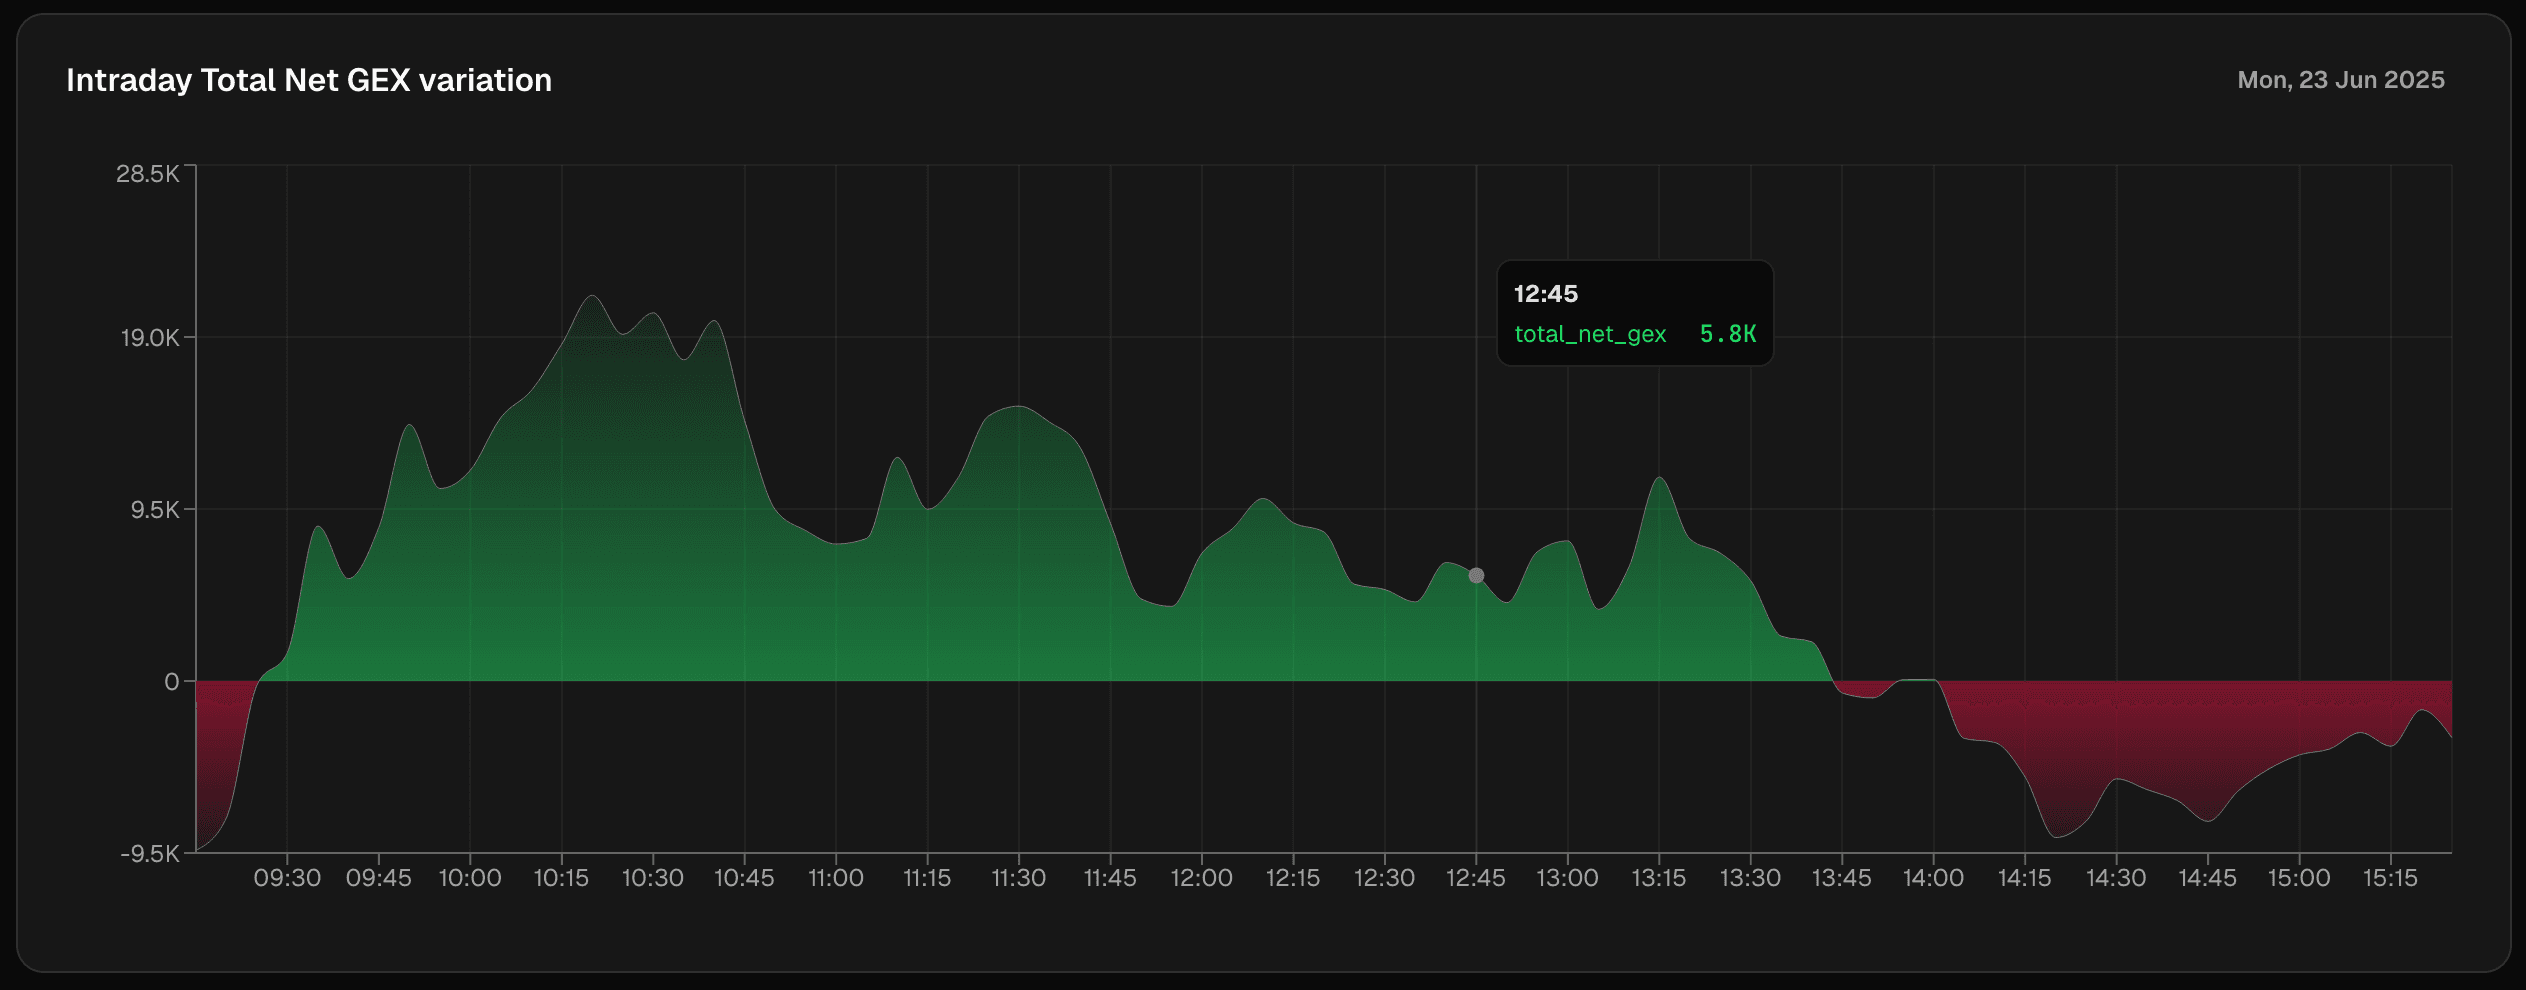 Intraday Total Net GEX variation
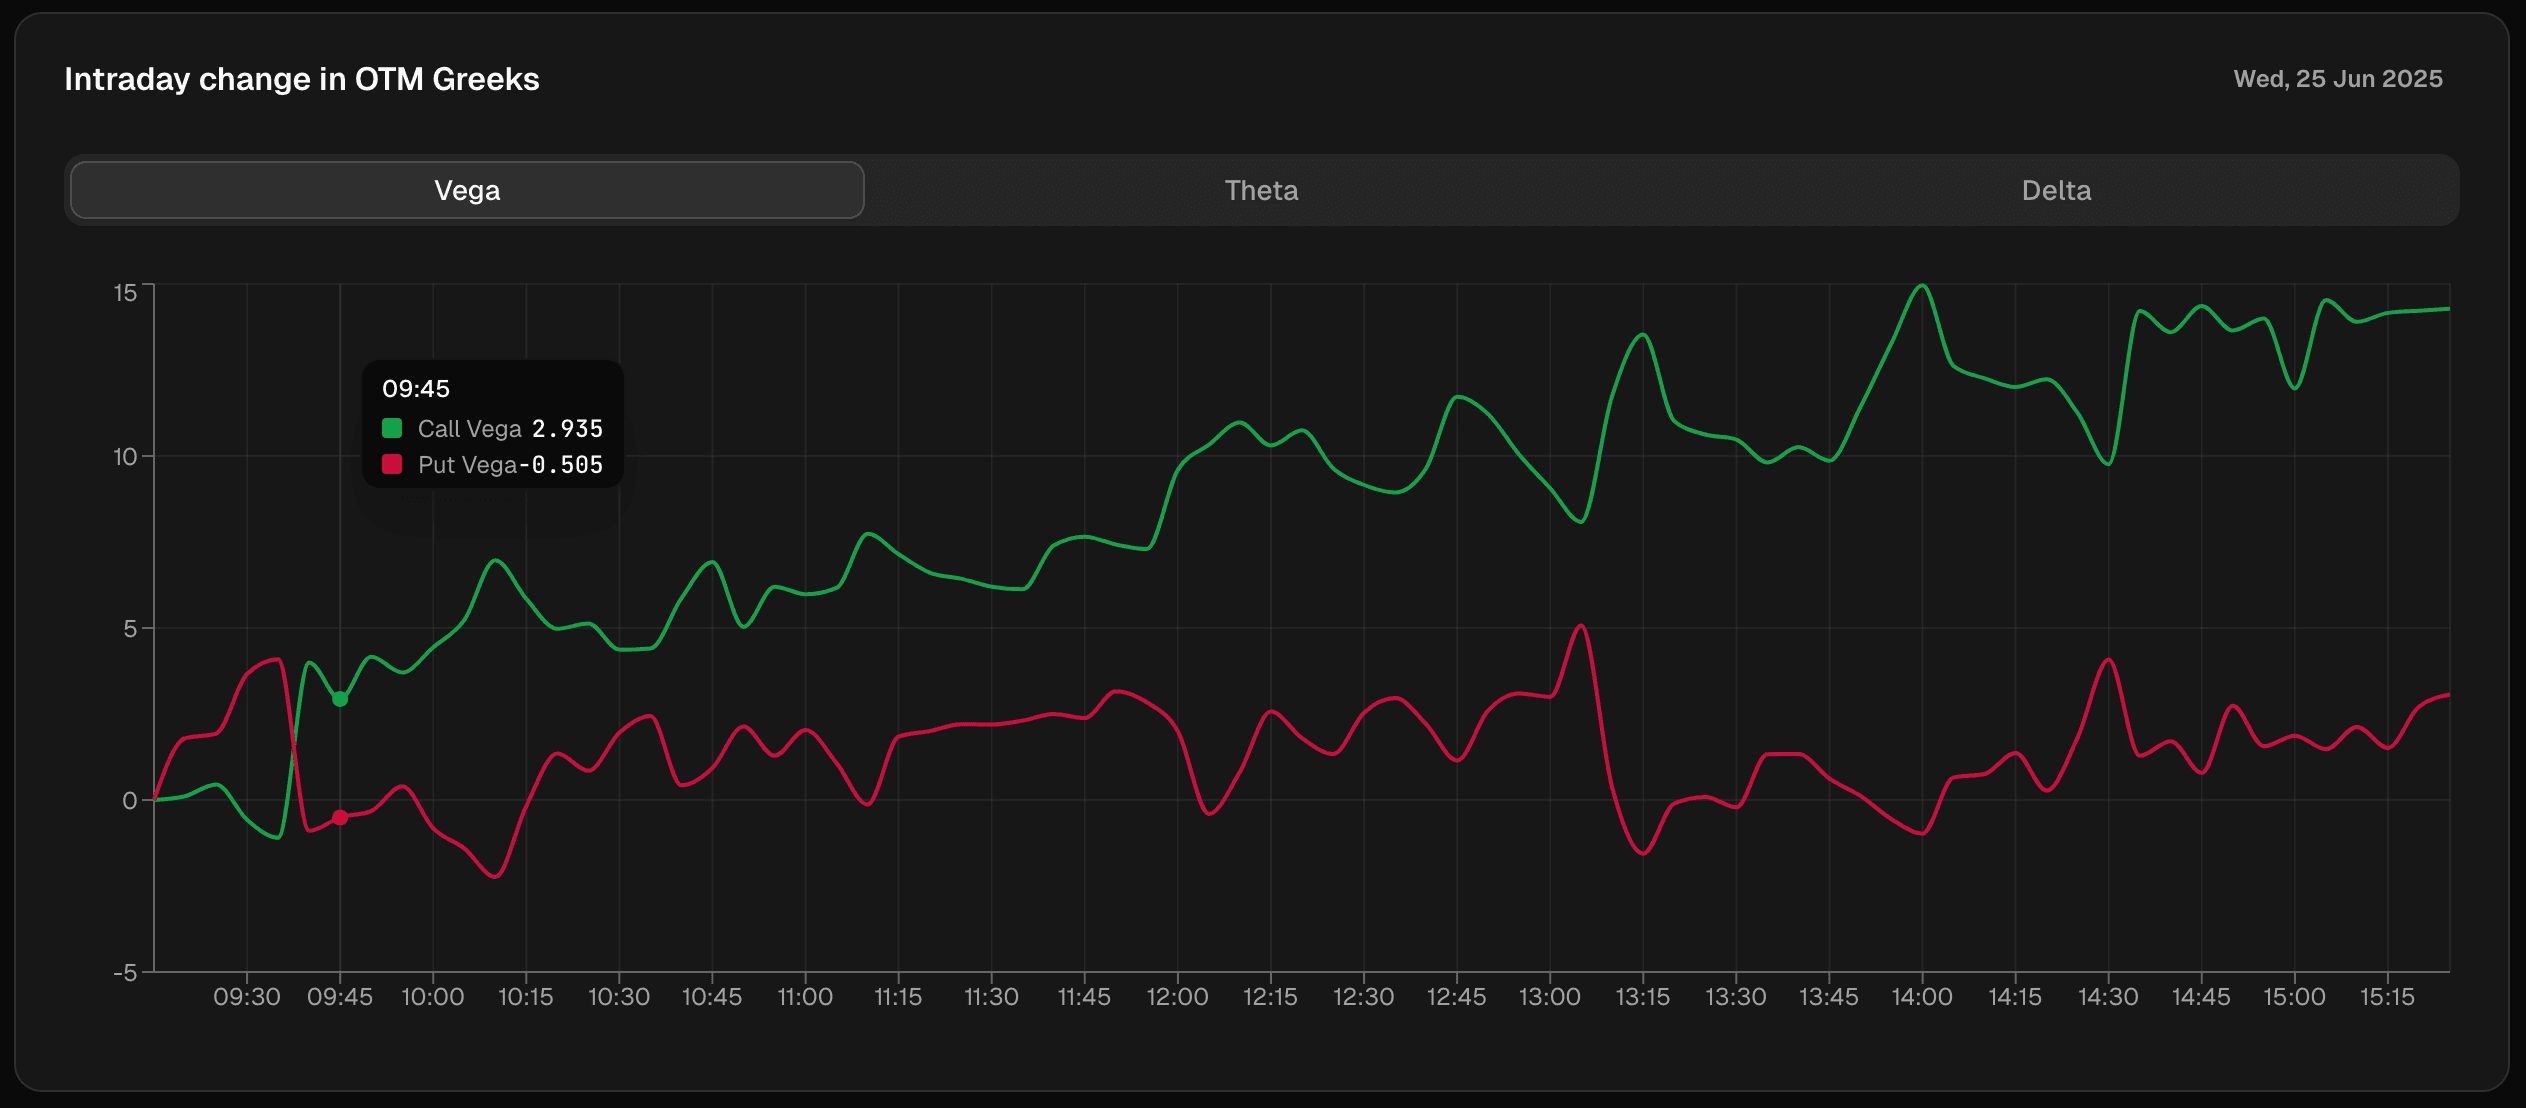 Intraday change in OTM Greeks
Positional Statistics:
Standard deviation-based analytics for any ticker, showing expected ranges for total moves, body sizes, gaps, and net changes across custom lookback periods.
Standard deviation-based analytics for any ticker, showing expected ranges for total moves, body sizes, gaps, and net changes across custom lookback periods.
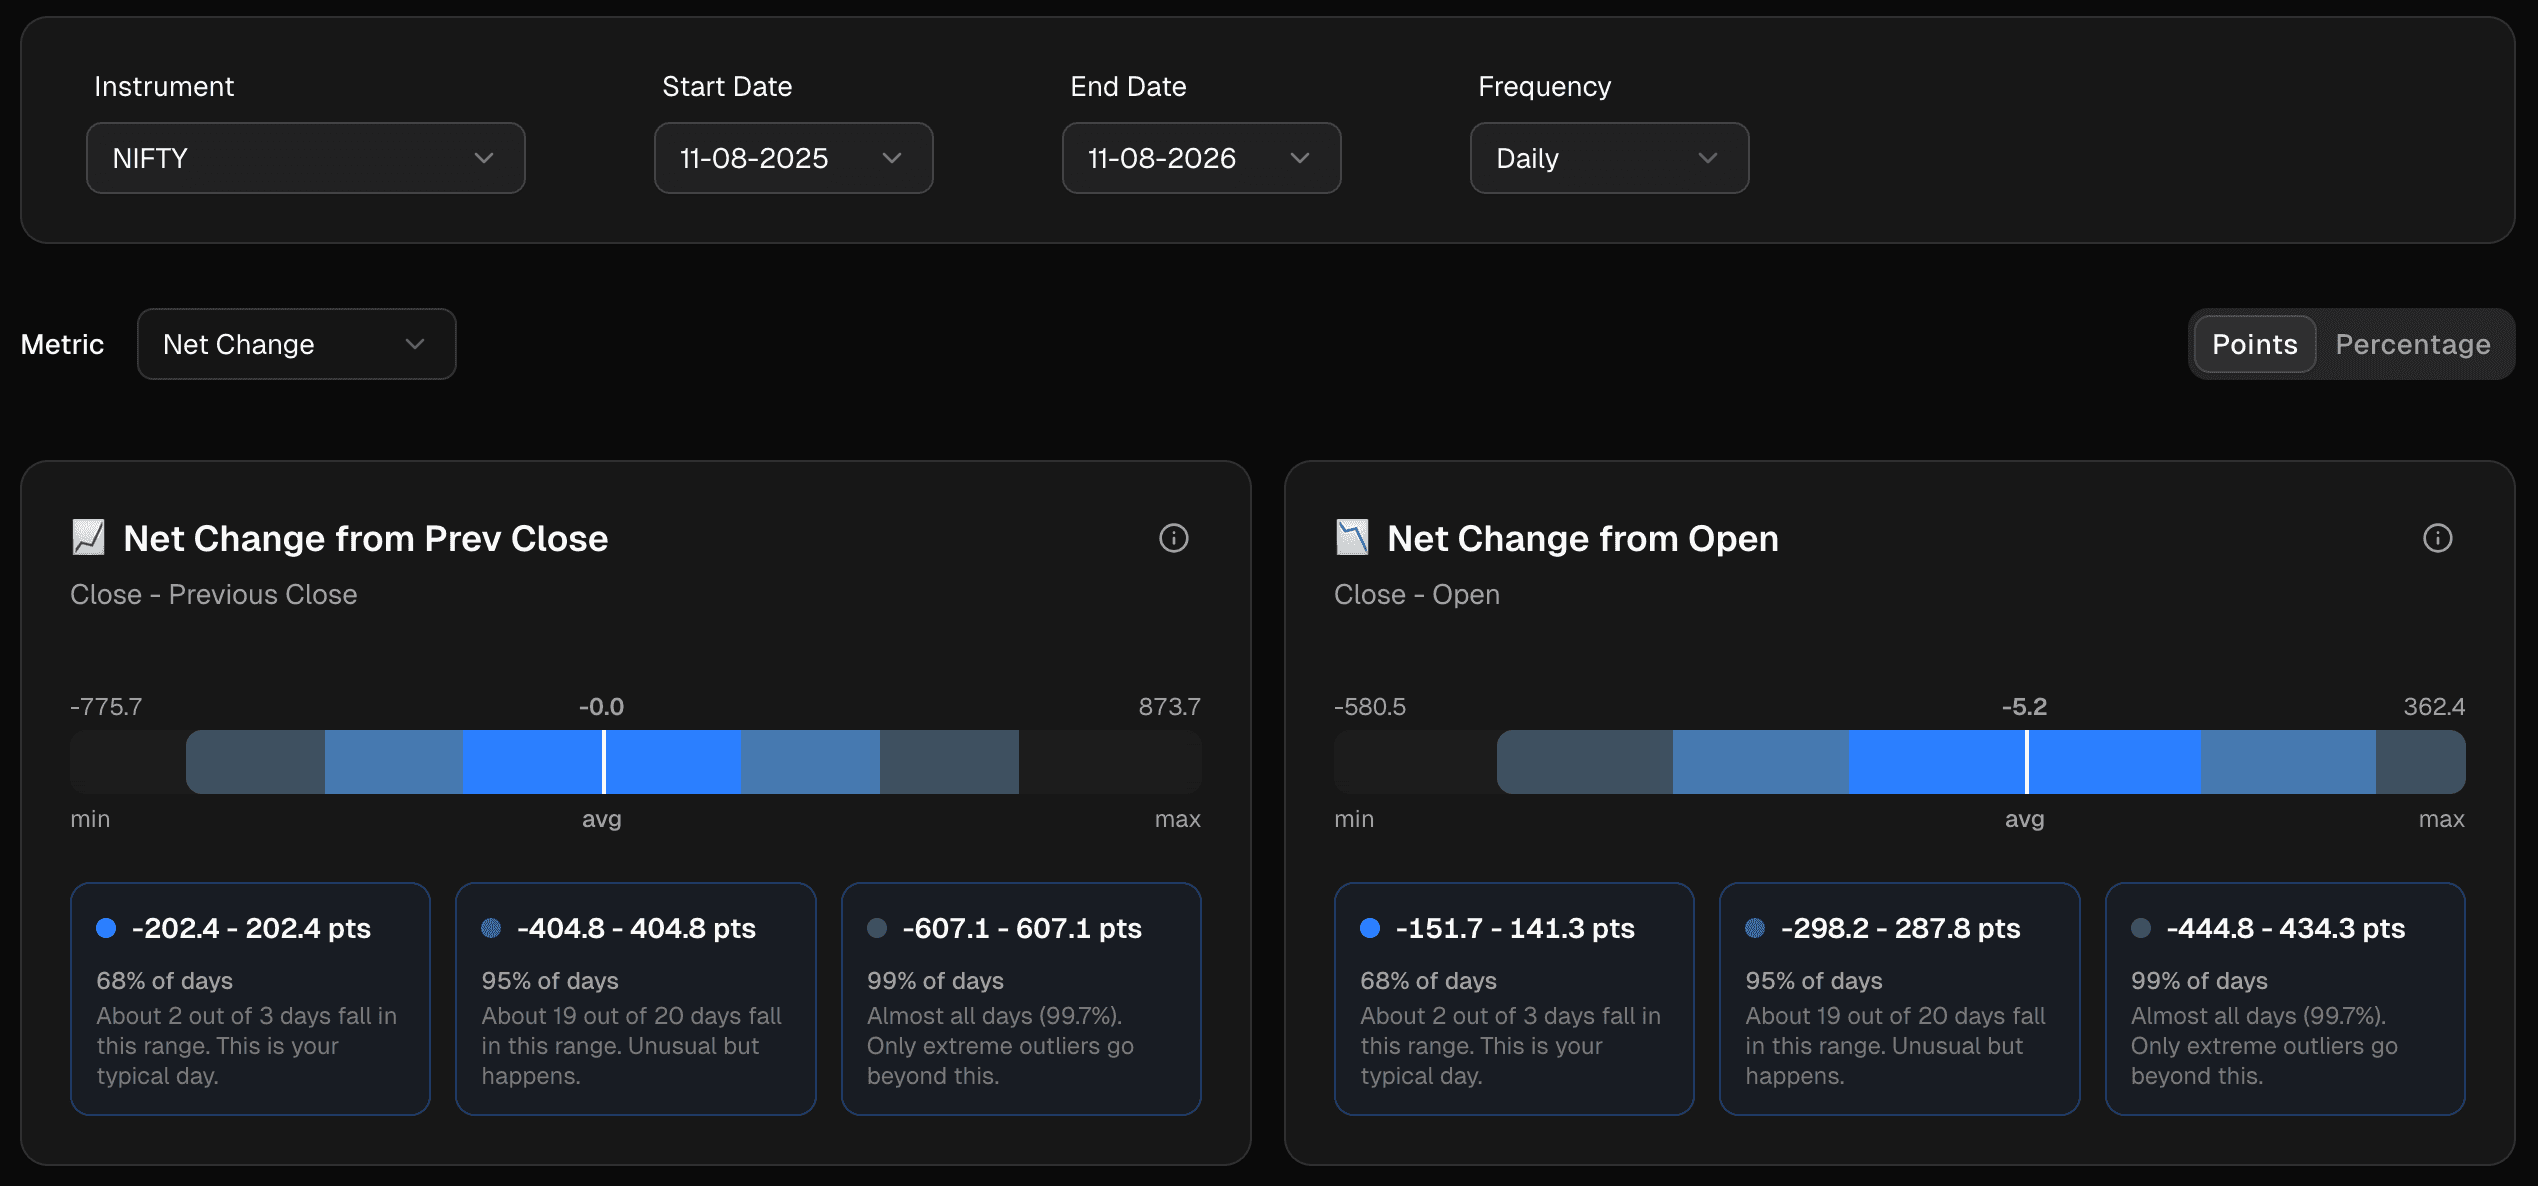 Std. dev. ranges of Net Change in Positional Statistics
HOW I BUILT IT
Idea to product without writing every line
I architected the entire system from scratch - deciding on the services and tools to be used, designing the data pipeline, database schema, API structure, and frontend components - and used AI coding agents to implement the heavy lifting. This let me move fast without getting down into the implementation details, especially during the initial days.
I started with the options data first, building it part-time over a month, coding during market off-hours, testing during live sessions, refining based on what actually helped my trading. The positional statistics tool began as a quick Streamlit prototype, then added it into the main platform when I realized how much I depended on it daily.
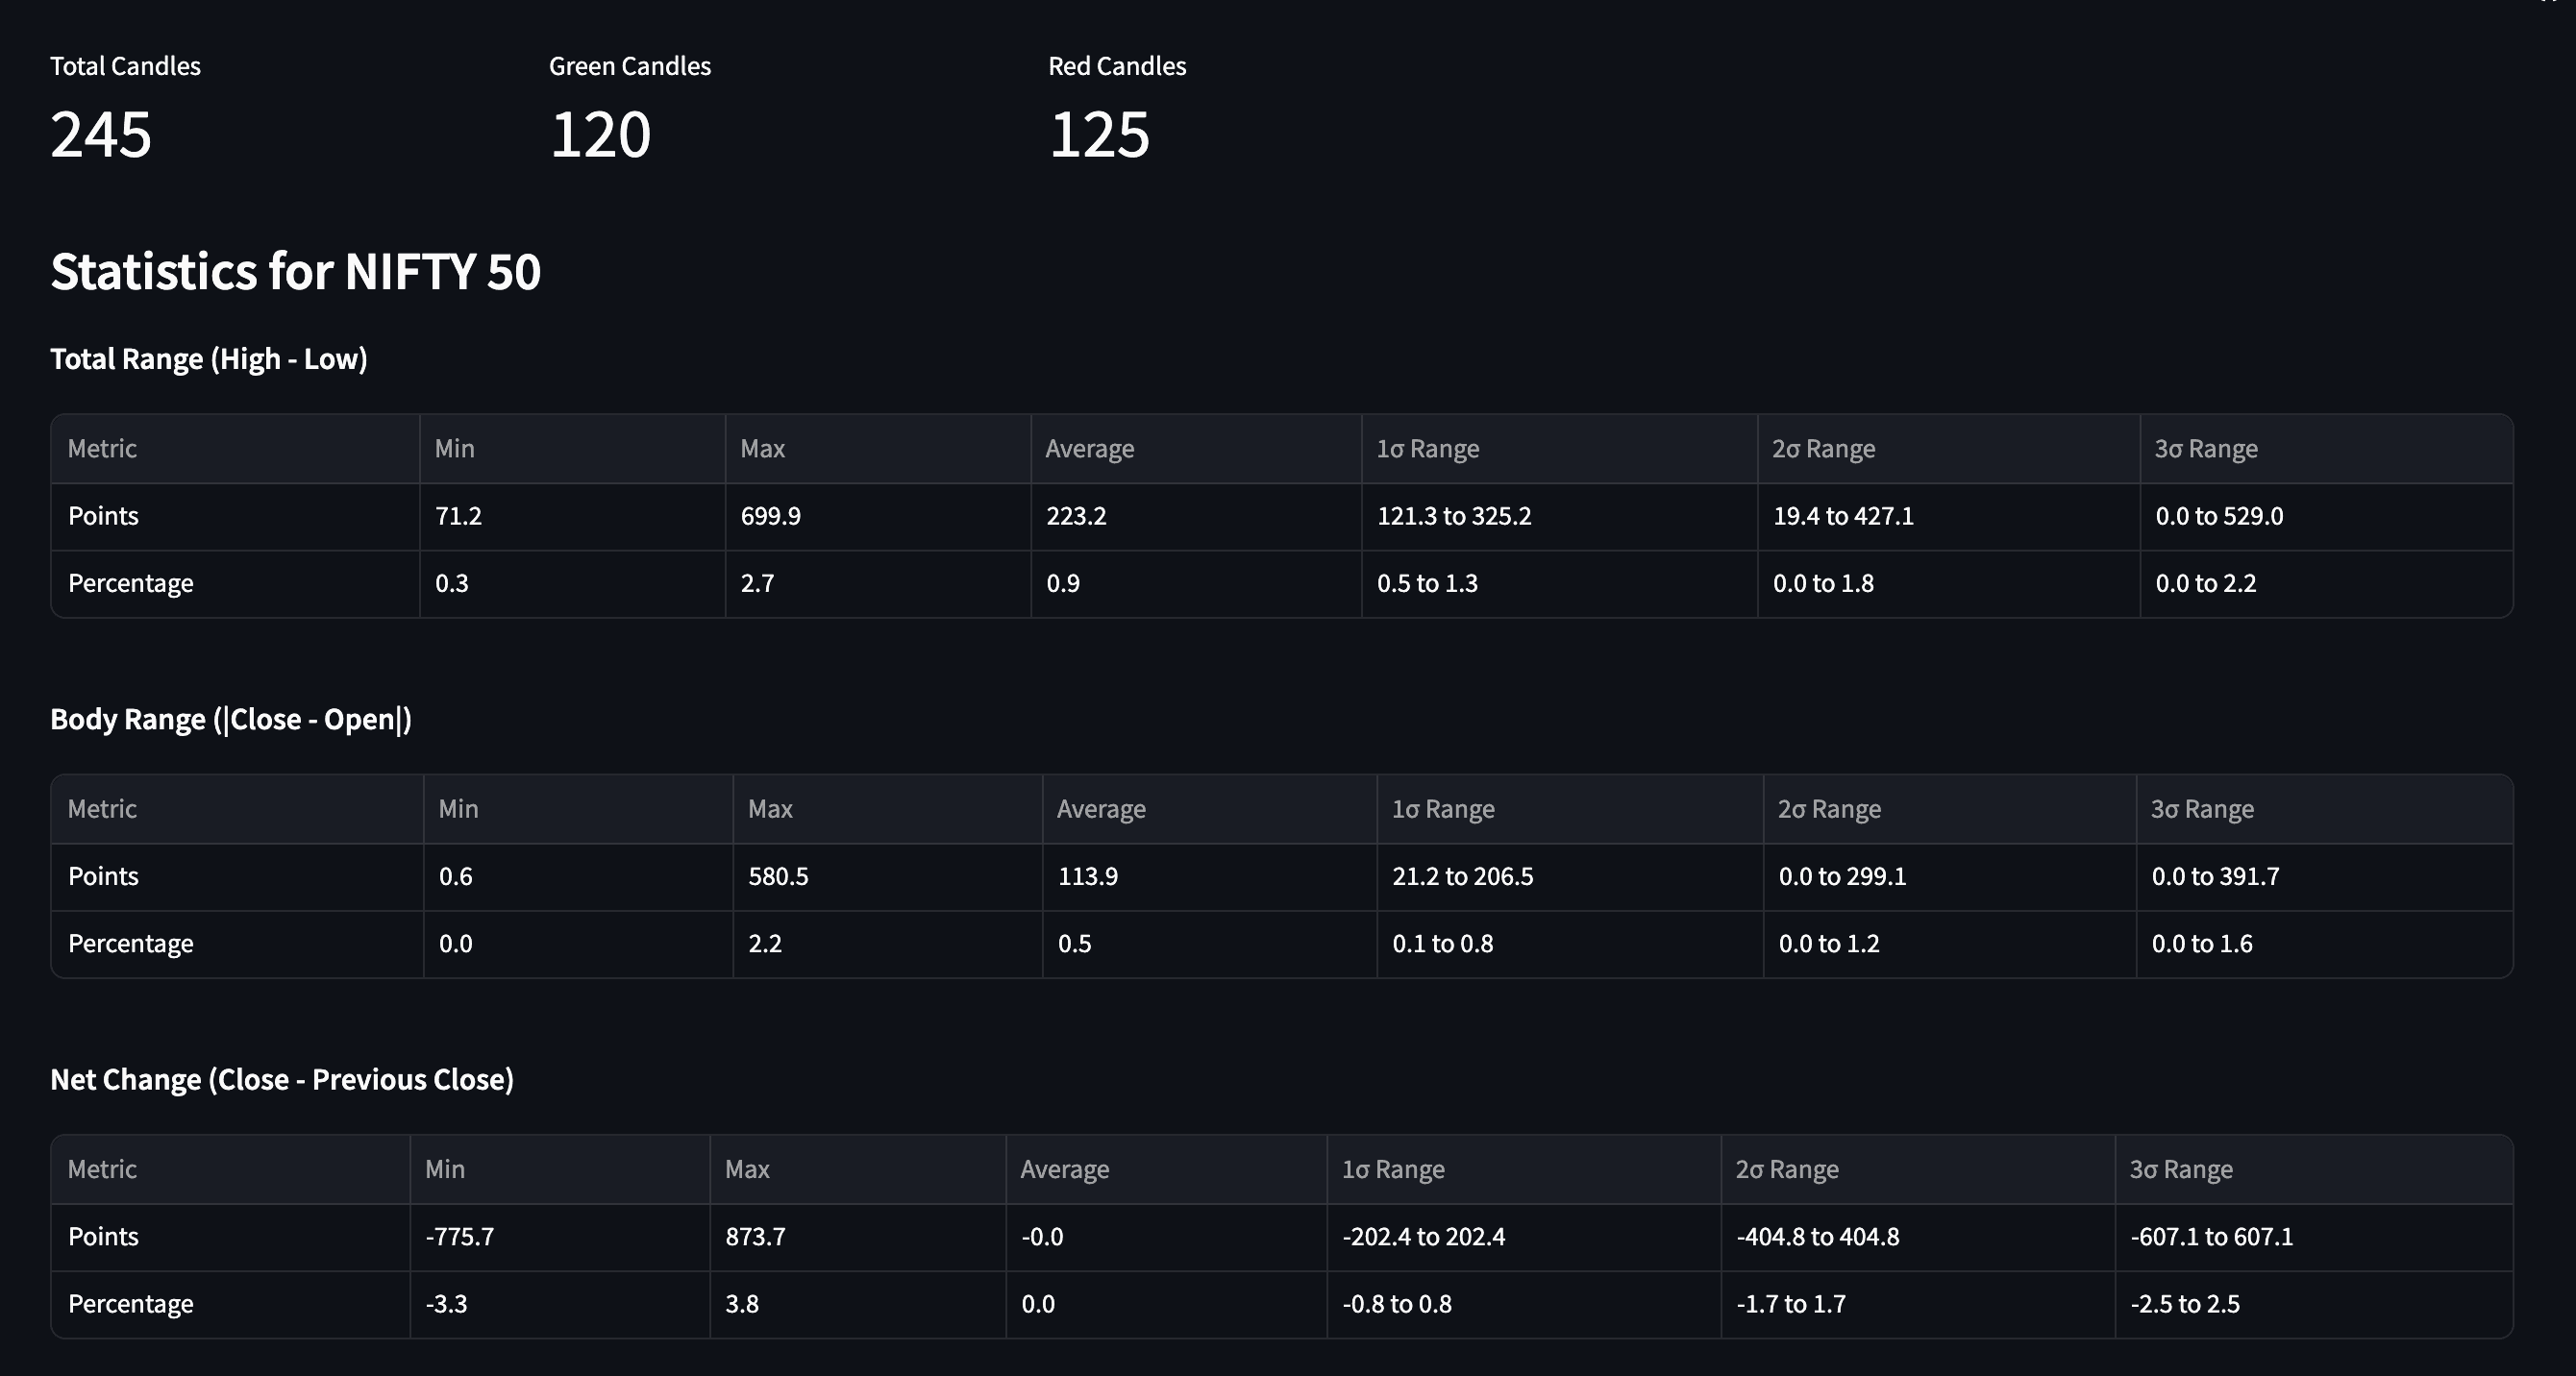 Positional Statistics initial prototype in Streamlit
Key decisions I made:
- Real-time data pipeline pulling options market data of Nifty and BankNifty from Dhan API every minute during live market hours.
- Strike filtering to focus only on relevant strikes near the money (+/- 20 to ATM), reducing unnecessary data and making faster queries.
- Dual-storage strategy keeping recent data at full granularity (1 min) while rolling up older data (to 5 min granularity) every night to reduce storage size.
- Pre-computed GEX metrics calculated at ingestion time, in a separate queue to fetching, and saved in the database, so the frontend stays ready and responsive.
- EOD data pulled from free sources for positional statistic page, so that I can cover all the tickers and need not store the data, as they are not required real time.
- Unified interface bringing both tools into a single Next.js application with consistent design and shared components.
The result is a platform that is more than an MVP and that handles tens of thousands of data points per day, serves real-time visualizations, and fits comfortably within free-tier database limits as a result of the architecture design.
HOW I TRADE WITH IT
Trading with context and data
Before taking trades:
I check the positional statistics to see what "normal" day's body size, candle size, net change looks like. If I'm selling a spread, I want to know the 1 and 2 standard deviation ranges for the day. This sets realistic expectations and prevents me from chasing moves that are statistically unlikely.
I check the positional statistics to see what "normal" day's body size, candle size, net change looks like. If I'm selling a spread, I want to know the 1 and 2 standard deviation ranges for the day. This sets realistic expectations and prevents me from chasing moves that are statistically unlikely.
During the session:
I monitor the strike-wise GEX to identify absolute GEX levels, that often act as price magnets and the top positive and negative GEX levels. I also monitor the intraday Net GEX variation across all strikes to check how much of a positive or a negative gamma regime the market is in to form a bias, and observed how the market reacted during those periods.
I monitor the strike-wise GEX to identify absolute GEX levels, that often act as price magnets and the top positive and negative GEX levels. I also monitor the intraday Net GEX variation across all strikes to check how much of a positive or a negative gamma regime the market is in to form a bias, and observed how the market reacted during those periods.
Managing positions:
Tracking the intraday OTM Greeks, especially the vega and theta, allowed me to quickly spot the sentiment changes. Seeing vega and theta build up in OTM options gave me an idea how the option sellers are positioning throughout the day helped me to be in the right side of the trade.
Tracking the intraday OTM Greeks, especially the vega and theta, allowed me to quickly spot the sentiment changes. Seeing vega and theta build up in OTM options gave me an idea how the option sellers are positioning throughout the day helped me to be in the right side of the trade.
Emotional regulation:
The biggest edge hasn't been any single trade - it's been the calm that comes from knowing whether a move is within normal statistical bounds or actually an anomaly worth reacting to. When price moves against me but stays within the 1 standard deviation range, I hold calmly. Whenever I wanted to carry over the positions to the next day, I check what the worst case scenarios are with the gap up and gap down statistics and re-position / position size accordingly.
The biggest edge hasn't been any single trade - it's been the calm that comes from knowing whether a move is within normal statistical bounds or actually an anomaly worth reacting to. When price moves against me but stays within the 1 standard deviation range, I hold calmly. Whenever I wanted to carry over the positions to the next day, I check what the worst case scenarios are with the gap up and gap down statistics and re-position / position size accordingly.
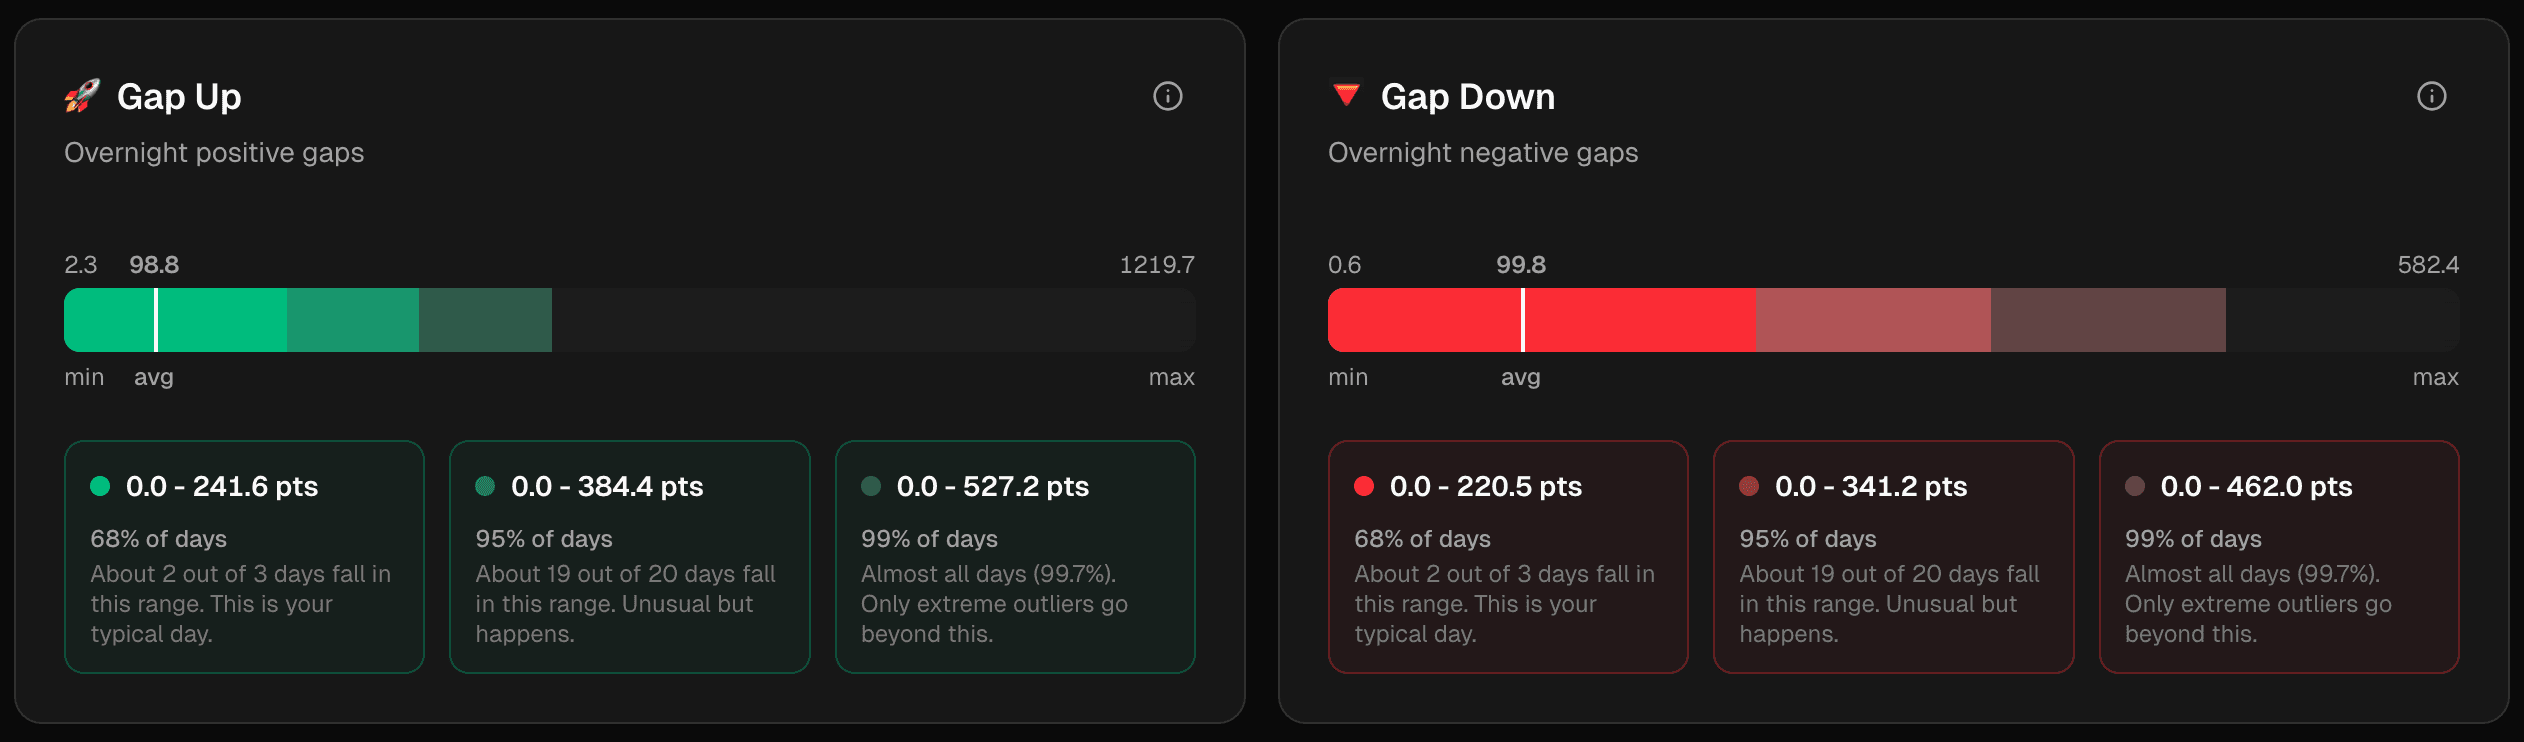 Gap up and Gap down std. dev. ranges
REFLECTION
I have the power to solve my own problems
This project proved that I can identify a gap in my own workflow, design a complete technical solution, and ship a functioning product without being limited by time availability or technical constraints. By leveraging AI for implementation while retaining full control over architecture and design decisions, I built something that paid for itself many times over through better trading outcomes.
The platform kept me grounded in fast-moving markets and consistently helped me avoid bad trades while identifying high-probability setups. More importantly, it confirmed that if a tool doesn't exist to solve my specific problem, I can build it - from concept to design to deployment.